
How to Use a Rent vs Buy Calculator
Follow a rent vs buy calculator guide covering comparable homes, mortgage details, ownership costs, results, a worked example, and scenario comparison.
How does this guide help you use the Rent vs Buy Calculator?
This guide explains which values to enter, how the Rent vs Buy Calculator processes them, and how to read the resulting estimate. Follow the sections below to check assumptions, compare realistic scenarios, avoid common input mistakes, and understand when an official source or qualified professional should take priority over a planning result.
A fair renting-versus-buying comparison uses similar homes and puts both choices on the same timeline. This guide explains how to prepare each input, read the net-worth result, and test the assumptions that can move the break-even year.
Use the Rent vs Buy Calculator for scenario planning. It does not predict home prices, investment returns, rent changes or personal tax consequences.
Before You Start
Choose a rental and purchase option that are reasonably comparable in location, size, condition, commute and amenities. Then gather current figures instead of relying on national averages.
- Asking price or realistic purchase price for the home.
- Cash available for the down payment and purchase costs.
- A mortgage note-rate quote and term.
- Current rent and renter insurance for a comparable property.
- Local property-tax, homeowners-insurance, HOA and maintenance estimates.
- Purchase closing-cost and future selling-cost estimates.
- The earliest, likely and longest periods you might remain in the home.
Loan Details
- Home price: enter the expected contract price, not the maximum price a lender might approve.
- Down payment: enter cash applied to the price. Purchase closing costs are calculated separately.
- Mortgage rate: use the annual note rate, such as 6.5 for 6.50%. Do not substitute APR in the payment formula.
- Mortgage term: enter the scheduled amortization period in years.
- Monthly rent: use current rent for the comparable rental, excluding renter insurance because it has its own input.
- Years to compare: enter how long the modeled buyer owns the home before selling.
Ownership Costs
Open Costs and growth assumptions to enter expenses that a mortgage-only comparison misses.
- Property tax, insurance and maintenance: annual percentages of the modeled home value.
- Monthly HOA: current association dues, grown by the owner-cost assumption.
- PMI estimate: annual percentage of the remaining mortgage balance while modeled loan-to-value is above 80%.
- Renter insurance: current monthly premium, also grown by the owner-cost assumption.
- Buying closing costs: percentage of the purchase price added to upfront buyer cash.
- Selling costs: percentage deducted from the modeled future home value.
Use a Loan Estimate and Closing Disclosure for transaction-specific mortgage charges. The calculator excludes utilities, moving, security deposits, renovations, capital-gains taxes and any cost not entered.
Extra Payments
The rent vs buy engine models scheduled mortgage payments only. An extra-principal plan changes the loan balance, interest and buyer equity path, so it should be tested separately rather than assumed.
First run the rent-vs-buy scenario with the scheduled loan. Then use the Extra Payment Calculator with the same mortgage principal, rate and term. If extra principal fits the budget, compare its interest savings and revised balance with the renter's alternative use of that same cash.
Confirm that the servicer allows additional principal and applies it as intended. Keep the comparison symmetrical: money assigned to extra principal should not also be counted as invested cash.
Read the Results
- Recommendation: identifies which scenario has the higher modeled net worth at the selected endpoint, or whether the values are approximately even.
- Estimated difference: shows the absolute gap, not a guaranteed gain.
- Break-even year: the first annual checkpoint when buying reaches or exceeds renting. It may be absent.
- Buyer net worth: sale-adjusted home equity plus any buyer investments.
- Renter net worth: invested buyer-upfront cash plus the renter's invested monthly savings.
- Initial monthly costs: useful for cash-flow context, but not the same as ending net worth.
- Annual chart and table: show whether the lead is stable, narrowing or reversing over time.
Worked Example
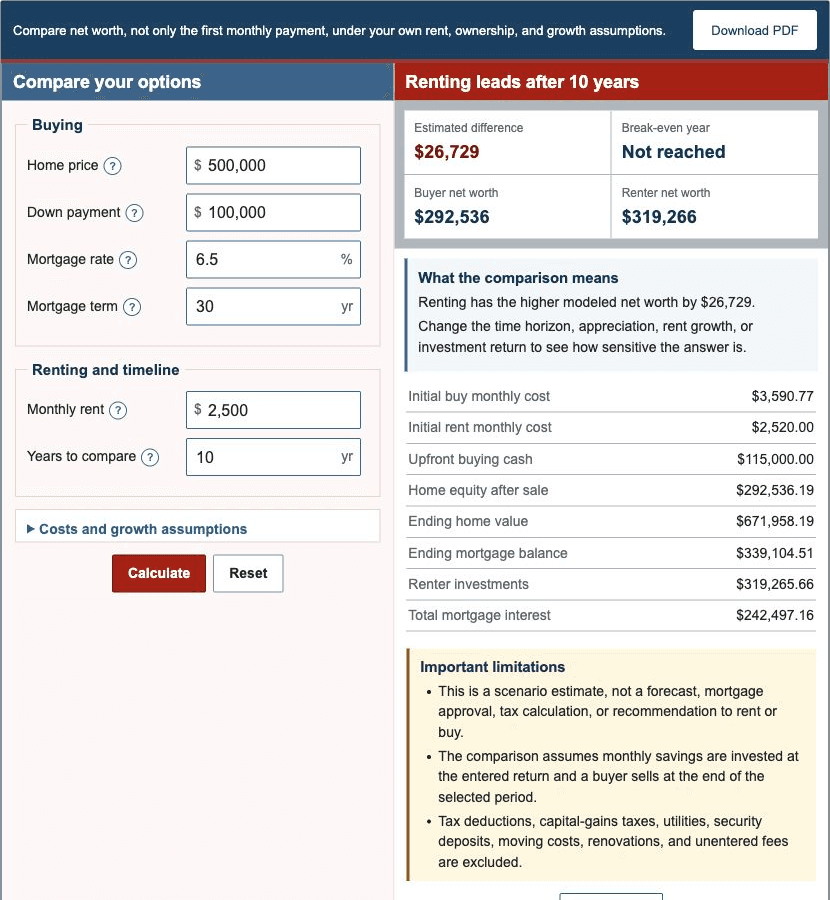
Assume a $500,000 home, $100,000 down payment, 6.50% 30-year mortgage, $2,500 monthly rent and a 10-year comparison. Use 1.20% property tax, 0.35% homeowners insurance, 1.00% maintenance, no HOA, 0.50% PMI, $20 renter insurance, 3.00% buying costs, 6.00% selling costs, 3.00% home appreciation, 3.00% rent and owner-cost growth, and 5.00% investment return.
- Mortgage principal is $500,000 - $100,000 = $400,000.
- The fixed principal-and-interest payment is $2,528.27.
- Initial modeled buying cost is $3,590.77; initial renting cost is $2,520.00.
- Upfront buyer cash is $100,000 + 3% of $500,000 = $115,000.00.
- After 10 years, sale-adjusted home equity is $292,536.19.
- The renter's modeled investment balance is $319,265.66.
- Renting leads by $26,729.47, and buying has not reached an annual break-even checkpoint.
Open Example 1 to compare this result with a three-year stay and a 15-year stay.
Compare Loans
Run one calculator scenario for each realistic mortgage offer while keeping the home, rent, expected stay and non-loan assumptions unchanged. This isolates the effect of the financing choice.
| Comparison item | Why it matters |
|---|---|
| Loan amount | Changes the payment, interest and initial equity. |
| Note rate | Controls the periodic interest used in the mortgage schedule. |
| Mortgage term | Changes payment size and the speed of principal reduction. |
| Closing costs and credits | Change the upfront cash invested in the renting scenario. |
| Mortgage insurance | Can increase ownership cost when the down payment is smaller. |
| Cash to close | Determines whether the purchase scenario is feasible, even when buying leads later. |
| Loan features | Adjustable rates, balloons or nonstandard amortization are not modeled by this fixed-rate engine. |
Compare official Loan Estimates on the same date and ask lenders to explain differences. A lower-rate offer can include higher upfront costs, and a lower payment can reflect a longer repayment term.